Survey About Reading Habit of GOLPET Students

By: Nong, To and Paulina

1

The pie shows that almost Three quarters of students like to read books at home. However, it illustrates that less than one third of students read books at the offices. In addition, a small number of students like to read in the park.

2

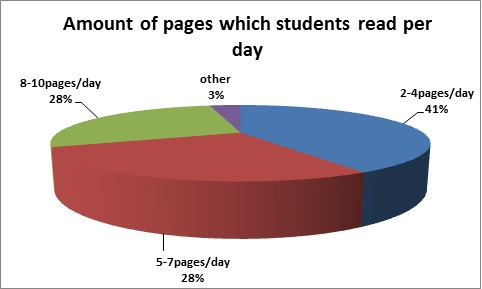
The pie illustrates that almost two quarters of students read 2-4 pages per day. Furthermore, the amount of GOLPET students read 5-7 pages are the same as 8-10 pages per day. However, it also demonstrates that the least of GOLPET students read more than 10 pages per day.

3

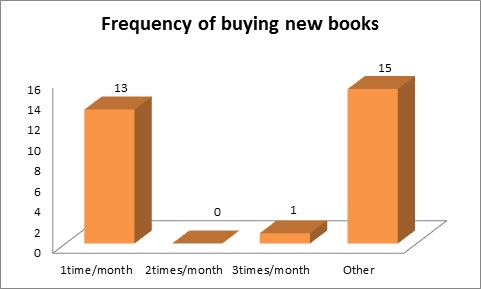
This column chart shows that no one like to buy a new book 2 times/month, only one person likes to buy a new book 3 times/month. Almost half of students prefer to buy a new book 1 time/month. More than half of GOLPET students prefer to buy different amount such as 1 time/3 months or a year and it depends on what they need.

4

The bar chart shows that over half of students read 1-2 times a week. On the other hand, one quarter of students do reading 3-4 times per week. However,  less of students read more than 6 times per week.

5

This bar chart shows that one quarter of students like to read fiction such as tales. At the same time, less than haft of students prefer to read non-fiction or history and almost half of students select their sources of reading on the internet, newspapers, sports….

The Health Survey of GOLPET Students

By Phan, Bee, Thip GOLPET Class A

Figure 1 

q1The bar chart measures the frequency of GOLPET students’ health checks. The most common attitude was for students to check their health once a year, which was the behavior of the majority of approximately 23 GOLPET students. This was followed by students who check their health every six months, and then there are a small number of students who never check their health.

Figure 2

q2

This clustered cylinder illustrates the most used health service of GOLPET students. The highest number of people uses the public hospital, approximately 60%, while 16% of people use the clinic and public hospital.

Figure 3

q3The Pie chart shows us the percentage of health symptoms which affect GOLPET students. The highest percentage of students had a fever and followed by a cold. Moreover, some students felt dizzy, some students had an allergy and the smallest pie piece is for other symptoms for example: headache, stomachache, etc.

Figure 4

q4The clustered pyramid illustrates the various payments the GOLPET students use for their health treatment. The huge number of payments was from their own pocket at 11 people. There are a small number of students who use social welfare cards, parents’ money and insurance.

Figure 5

q5

 According to the chart, the amount of money that GOLPET students pay for health treatments are not same. Most of them spend their money around 400,000-900,000 kip per year for health treatments.
Some of them spend more than 1,000,000 kip per year. Although, there are also a small number of GOLPET students who are spend money less than 300,000 kip per year.

survey about social media usage in GOLPET students

By: Hou, Anny, Joe

The graph shows types of social media that GOLPET students use such as Facebook, WhatsApp, Line and WeChat. Most students prefer using Facebook with 20 followed by WhatsApp with 9 people . On the other hand, there are no students using Line and WeChat regularly.

The graph shows types of social media that GOLPET students use such as Facebook, WhatsApp, Line and WeChat. Most students prefer using Facebook with 20 students. This is followed by WhatsApp with 9 students . On the other hand, there are no students using Line and WeChat regularly.

The pie chart compares different purposes usage social media. Communication is the main reason for using social media with 19 users. Searching information is an important reason that people using social media with 8 students, play game and sending information are not important for most GOLPET students.

The pie chart compares different purposes for GOLPET students who use social media. Communication is the main reason for using social media with 19 users . Searching information is an important reason why people use social media with 8 students. Playing games and sending information are not important for most GOLPET students.

This bar chart shows how much GOLPET students use the internet per day. There are around 90% of GOLPET students who use the internet for one or two hours per day. Around 10% of students use the internet for three hours or more than three hours.

This bar chart shows how much GOLPET students use the internet per day. There are around 90% of GOLPET students who use the internet for one or two hours per day. Around 10% of students use the internet for three hours or more than three hours.

The graph presents GOLPET students rating of the quality of internet access. The majority of students rate their internet connection as good. This is followed by smaller amounts of students who consider their service to be fair with 7 and then very good with 4 students.  Just one person believes they have poor internet access.

The graph presents GOLPET students rating of the quality of internet access. The majority of students rate their internet connection as good. This is followed by smaller amounts of students who consider their service to be fair with 7 and then very good with 4 students. Just one person believes they have poor internet access.

This bar chart shows what device GOLPET students use for connecting to the internet. The more than three quarter of students use smart phones to connect to  the  internet. This is followed by laptop which is a lot lower and then PC. No one use Tablet for connecting.

This bar chart shows what device GOLPET students use for connecting to the internet. More than three quarters of students use smart phones to connect to the internet. This is followed by laptops which are a lot lower and then PC. No one uses Tablets for connecting.

Popular Subject And Activities of GOLPET Students 2014-2015

Summarized by: R, Ly, Nou (GOLPET A)

Most Popular Subject

This pie chart shows the popular subjects of GOLPET students measured by percentage. According to the research of 29 GOLPET students, over one third of students liked Communication (Comms). The amount of students who prefer Writing and Reading were slightly smaller than comms. Lastly, the rest of students desired Spoken English Accuracy (SEA).

Most popular Activities

The bar chart measures popular activities of 29 GOLPET students. The horizontal axis represents the activities in classes. The vertical axis shows the percentage of students. Nearly half of students loved giving presentations, while Self Direct Learning (SDL) was considerably lower than presentations. Discussions, Games and Group Activities combined equal the popularity of Presentations.

Least Popular Subject

This cone chart indicates unpopular subjects of GOLPET students. The Vertical axis represents the percentage of students, and the horizontal axis represents the subjects. Nearly one third of students disliked Computing and Grammar. Whereas, 17% of students were unhappy with Writing. Lastly, less than 10% of students dissatisfied with Communication (Comms), Information Literacy (IL), Learning Strategies (LS) and Reading.

Least Popular Activities

This doughnut reveals unpopular activities of GOLPET students by percentage. The amount of students who dislike Self Direct Learning (SDL) and Games are equal and are more than half of overall. The percentage of Students who did not prefer Group Activities (Group Acts) was massively smaller than SDL and Games. In addition, Discussion, Research and Presentation combined are almost half of the amount of students.

Time Spending For Homework

This bar chart recorded the time spent by GOLPET students on doing homework. The vertical axis represents the percentage of students. The Horizontal axis represents the period of GOLPET students spending on doing homework. Over one third of students did homework for one hour per day. Nearly one third of students spent 30 minutes doing homework, and it was slightly higher than the amount of students who did homework for one and a half hour per day. The least of students that covered 14% spent two hours on doing homework a day.

Survey about favorite Lao foods of GOLPET students

By : Keo, Lae and Tou (KLT)

     The survey was conducted for the favorite Lao foods, comprised of five questions, in January 29, 2015. There were 29 respondents (15 females) who study in both A and B classes attend the six-month course for the Government of Lao Professional English Training (GOLPET) at Vientiane College.

Pie Chart 1

Figure 1

Figure 1: The pie chart shows which foods were the favorite of GOLPET students. Overall, it is evident that Larp is the most popular food; followed closely by Papaya Salad, at 35% and 31% respectively. Also, nearly one-fifth of students eat cooked and uncooked vegetables, whereas, 10% of students consume Bamboo Soup. And other foods that are not mentioned in this survey are small.

Taste

Figure 2

Figure 2: The bar chart illustrates what taste the students prefer. Firstly, spicy is the top flavor according to 41% of students. Secondly, it is followed by unsalted at 31% which is 10% less than spicy. Interestingly, salty, sour and other types are not popular compared to spicy, sweet and unsalted.

Eating

Figure 3

Figure 3:  The bar  chart indicates how frequently students eat their favorite food. Most students enjoy to eat their favorite food about two or three times a week. In addition, 14% of GOLPET students have their most popular food around four times a week. Moreover, 7% of GOLPET students enjoy their traditional food one time every week.

Cooking

Figure 4

Figure 4:  The bar chart demonstrates how frequently students cook their favorite Lao food each week. The biggest segments students cook their favorite food two or five days. Each of those segments equal one – fifth of all GOLPET students. Similarly, the second two groups of students cook their popular food every three or seven days per week.

Lao or foreign

Figure 5

Figure 5: The chart shows the percentage of GOLPET students who prefer eating Lao food or foreign food. More than 90% of students consume more Lao food than foreign food, whereas, the amount of students who eat mostly foreign food is small.